First, we need to graph the Corona Virus Worldwide, without China, then narrow it down to individual states.
That way you can see things the big numbers don’t tell you.
First, we get rid of the China numbers, by throwing it out of the equation. It’s a mathematical anomaly.
First, China’s (self-reported) numbers are not accurate, and likely never were. 1) We actually don’t know for sure when the virus outbreak began in China, 2) when it was first noticed by their state medical officials, 3) when the state began responding to it (government bureaucracies everywhere are notoriously slow to respond to anything outside their little box of daily duties…remember how US agencies filed away reports of suspicious activity before 91 into File 13?), and 4) their early containment efforts.
We have no idea how many people died in China in late 2019, or were treated and recovered. No sane person would be obliged to believe what China told the world, although WHO at the UN reported them faithfully.
China-the-government probably was in total face-saving mode by January, 2020.
We also have learned that China stopped testing for corona virus at least a week ago, but reporting that there were no new cases, as if the disease had been arrested.
So the total numbers of cases in China as well as deaths have to be dropped from any calculation of worldwide totals. It skews all comparisons.
All we need to know is that all the corona-viruses in the world had their original home in China and that in the United States those sources of contact stopped coming here from China on January 31, when President Trump stopped all commercial flights.
I recommend this chart from the CDC, posted daily with case and death rates for all the countries, and all the American states:
In the week that I have been graphing, 3/18 to 3/25, America has gone from 6th to 3rd in total cases reported. 2nd if you exclude China. But we are 6th in total deaths (5th w/o China), and a far distance from the lot if you compare the United States against the entire European Union, which is of comparable population, and which had an approximate equal number of connections with China; commercial, tourism, educational, etc.
Europe combined has 216,000 reported cases to our 55,000, and nearly 12,000 deaths to our 804.
Of course I lay this difference to President Trump’s jumping the gun by shutting down commercial traffic with China on 31 Jan, then shutting down European air traffic a few days later, and only recently, shutting off all private land-traffic with our neighbors to the north and south.
Italy, which is No 1 in corona cases and deaths outside China, and 57% of the European total, earned that distinction due to the cupidity of their own leftist government, where, if you don’t already know, China exerted a lot of influence, especially in the Lombardy region of northern Italy, where China had invested deeply, and thousands of Chinese had emigrated, much like Russians to Cuba in the 1960s-70s.
It would be Feb 23, 3 weeks after Trump, that Italy would cut off China travel. And this would be after the idiotic mayor of Florence, to show the region’s solidarity, announced a Hug-a-Chinese Day. No, really. I can see the mayor of Berkeley pulling this sort of stunt.
Of course, considering the vast number of pre-Jan 31 contacts Americans actually had with the virus, whether found in Mainland China, Hong Kong or Singapore, returning business people, tourists, a returning cruise ship, or a research lab at Harvard, presumably there have been no new additions of the virus in America for over 50 days. However it is spread, it is spread by contact w/I the US, all from those original pre-Jan 30 arrivals.
We can’t know how many things we can touch that were also touched by a virus-infected person, or how quickly the virus dies on its own. We haven’t found Typhoid Mary’s (people who are asymptomatic, who can carry the disease but still pass it on) but the 14-day incubation of the virus, makes it difficult for persons who test positive to be able to retrace 2 weeks of touching. Think about it.
This is what the national shut down is all about. And the president is hopeful, and probably has some mathematical backing to believe that the number of new cases will begin to drop by mid-April. He has targeted Easter, April 12. Apropos.
You can make you own charts with scratch paper, graph paper, or the tools your Documents File gives you.
Messing with the Numbers
The President has set a “GO” date of Easter, 12 April for opening the doors back up, and allowing people to go back to work. There will be clusters where that won’t be advisable. That’s why we want to watch the state numbers, to see where those clusters are. They are easy to find in Tier I and Tier II states:
(See the state lists) NY is a tier all by itself, with over 26,000 cases (almost half of the US total) and 271 dead, thru 24 Mar.
Tier I are the next 11 states, w/ cases ranging from 3675 to 803, This tier has 18,375 total cases, and 372 dead;
Tier II are the next 20 states, w/case ranging from 723 to 183, with 7301 total cases, and 90 dead
Tier III are the last 21 states, w/cases ranging from 157 to 20, 1633 total case and 22 deaths.
15 states have Zero deaths, incl 2 Tier II states, and 7 have only one death, also incl 2 Tier II states.
An ugly truth is that states and city clusters are largely blue, (only 4 blue states are Tier III, while only 3 red states are Tier I) and those clusters have a political desire to see these numbers continue to rise at a steady upward rate, since, first and foremost they may cause President Trump to fall short of his Easter Sunday goal of justifying a back-to-work release.
(You will notice not all states report recoveries. There can be both medical, bureaucratic and political reasons why this is so.)
As you can tell, if you open to any single state, you will see the cases tend to cluster in more populated areas within the state. This makes sense….the presence of both national and international airports, trains, ports. And these larger cities and their out-lying suburban feeder-counties are usually the economic engines of the whole state; business, education, as well as the political center of the states.
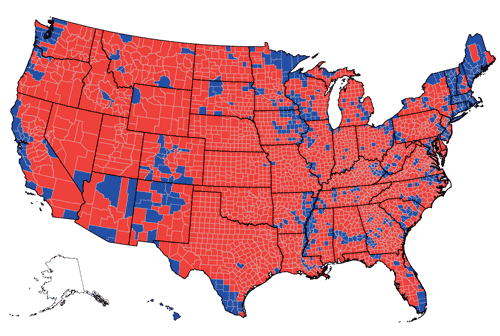
The best map of these clusters is not medical, however, as I think you would find the CDC chart overlays quite well with the voting map of the 2016 election.

State bureaucracies and medical centers are largely found in those blue areas, as are economic centers most affected by the virus shutdown. Ohioans are angry that their governor, a Republican, has shut down the state because of what is largely four blue clusters. Trump knows the working classes of those blue spots are just as anxious to get back to work as the rest of the nation, so it is here that he has directed his game plan, to rescue the life’s blood of the very blue centers of power that hate him.
I won’t prolong any political discussion. You all know the score since now we all know the Democrats’ hearts to have been revealed to a depth we could never have imagined had Ms Pelosi not laid it bare in such a callous and arrogant manner. “Let them eat cake.”
With this chart you can graph daily the world and the US, and the blue clusters as their numbers will change just by consulting Corona Virus, CDC daily, and preferably at the same time daily so as to be accurate.
Then watch how some Level II and even I (I counted 4) that are under blue governors may try to steal Trump’s rescue. Witness the executive action by the governor of Nevada, (278 cases, 4 deaths) Steve Sisolak, banning the prescribing of the anti-malarial drug chloroquine. Having had some experience with chloroquine in the 80s (as an anti-malarial) I know that it never was for everybody, whether they were going to visit the jungles of Asia or not. So this governor’s edict could be medically justified, or, just one of many ways Democrats can, when available to them, use the power of their offices in the states and the cities to slow down the recovery.
Be especially watchful of how state offices collect and report cases, and declaring ordinary flu illnesses and deaths to be corona related. (It’s hinted that Obama medical statisticians did the reverse with H1N1 deaths in 2010.)
Also, Italy has chosen to deny ventilators to infected patients over the age of 60. This may be due to a shortage, but it smacks of socialist-triage, which Obama promised during his campaign Q&A that his new vision of national health care would simply give grandmother an aspirin to ease the pain while she waits it out.
The media is generally hyping that a massive up-surge in deaths is lurking just around the corner. They need “numbers” to back that up in the coming days and weeks.
Donald Trump is definitely not of the triage mind. Being a hands on planner his inclination is to get out in front of problems that might arise in the supply line. Most federal and state bureaucrats never even think in those terms, so, as the old axiom goes, we should never indict that which can be blamed on incompetence. (See my recent John Cleese post to understand what this means in the professional world; professionals who don’t know they don’t know). Still, since between Evil Intent and Incompetence, there is Indifference, a bureaucrat’s signature trademark, and the Left’s best ally in government. we can still lay the blame squarely on their heads.
So, pay more attention to the states and cities, your states and blue city clusters, for you will find much that people can do something about come election day. Find candidates who have added “bureaucratic clean up” to their campaign promises.